I’ve written before about optimising memory in Eclipse, previously looking at the preponderance of new Boolean() (because you can never have too many true or false values).
Recently I wondered what the state of other values would be like. There are two interesting types; Strings and Integers. Strings obviously take up a lot of space (so there’s more effect there) but what about Integers? Well, back when Java first got started there was only new Integer() if you wanted to obtain a primitive wrapper. However, Java 1.5 added Integer.valueOf() that is defined (by JavaDoc) to cache values in the range -128…127. (This was because autoboxing was added in with generics, and autboxing uses Integer.valueOf() under the covers.)
There were other caches added for other types; the Byte type is fully cached, for example. Even Character instances are cached; in this case, the ASCII subset of characters. Long values are also cached (although it may be that the normal values stored in a Long fall outside of the cacheable range, particularly if they are timestamps).
I thought it would be instructive to show how to use Eclipse MAT to see how to identify what kind of problems are and how to fix them. This can have tangible benefits; last year (thanks to the kind reminding of Lars Vogel) I committed a fix that was a result of discovering the string www.eclipse.org over 6000 times in Eclipse’s memory.
Once you install Eclipse MAT, it doesn’t seem obvious how to use it. What it provides is an editor that can understand Java’s hprof memory dumps, and generate reporting on them. So the first thing to do is generate a heap dump from a Java process in order to analyze it.
For this example, I downloaded Eclipse SDK version 4.5 and then imported an existing “Hello World” plug-in project, which I then ran as an Eclipse application and closed. The main reason for this was to exercise some of the paths involved in running Eclipse and generate more than just a minimal heap.
There are many ways to generate a heap; here, I’m using jcmd to perform a GC.heap_dump to the local filesystem.
$ jcmd -l
83845
83870 sun.tools.jcmd.JCmd -l
$ jcmd 83845 GC.heap_dump /tmp/45.hprof
83845:
Heap dump file created
Normally the main class will be shown by JCmd; but for JVMs that are launched with an embedded JRE it may be empty. You can see what there is by using the VM.command_line command:
$ jcmd 83845 VM.command_line
83845:
VM Arguments:
jvm_args: -Dosgi.requiredJavaVersion=1.7 -XstartOnFirstThread -Dorg.eclipse.swt.internal.carbon.smallFonts -XX:MaxPermSize=256m -Xms256m -Xmx1024m -Xdock:icon=../Resources/Eclipse.icns -XstartOnFirstThread -Dorg.eclipse.swt.internal.carbon.smallFonts -Dosgi.requiredJavaVersion=1.7 -XstartOnFirstThread -Dorg.eclipse.swt.internal.carbon.smallFonts -XX:MaxPermSize=256m -Xms256m -Xmx1024m -Xdock:icon=../Resources/Eclipse.icns -XstartOnFirstThread -Dorg.eclipse.swt.internal.carbon.smallFonts
java_command: <unknown>
java_class_path (initial): /Applications/Eclipse_4-5.app/Contents/MacOS//../Eclipse/plugins/org.eclipse.equinox.launcher_1.3.100.v20150511-1540.jar
Launcher Type: generic
Opening the heap dump
Provided that Eclipse MAT is installed, and the heap dump ends in .hprof, the dump can be opened by going to “File → Open File…” and then selecting the heap dump. After a brief wizard (you can cancel this) you’ll be presented with a heap dump overview:

This shows a pie chart showing which classes contribute to most heap space; moving the mouse over each section shows the class name. In the above image, the 3.8Mb slice of the pie is selected and shows that it is due to the org.eclipse.core.internal.registry.ExtensionRegistry class.
To find out where duplicate objects exist, we can open the Group By Value report. This is under the blue icon to the right of the profile, under the Java Basics menu:

When this menu is selected, a dialog will be presented, which allows one (or more) classes to be selected. It’s also possible to enter more specific searches, such as an OQL query, but this isn’t necessary at first.
To find out what the duplicated strings are, enter java.lang.String as the class type:

This then shows a result of all of the objects which have a .toString() method that’s the same, including the number of objects and the shallow heap (the amount of memory taken up by the direct objects but not referenced data):

The result type is sorted from the number of objects and then shallow heap. In this case, there are 2,338 String instances that have the value true taking up 56k and 1,051 instances that have the value false. You can never be too sure about the truth. (I want to know what JEDgpPXhjM4QTCmiytQcTsw3bLOeXXziZSSx0CGKRPA= is and why we need 300 of them …)
The impact of duplicate strings can be mitigated with Java 8’s -XX:+UseStringDeduplication feature. This will keep all 2,338 instances of String but repoint all of the char elements to the same backing character array. Not a bad tune-up, and for platforms that require Java 8 as a minimum it may make sense to enable that flag by default. Of course tooling (such as Eclipse MAT) can’t tell when this is in use or not so you may still see the duplicate data referenced in reports.
What about Integer instances? Well, running new Integer() is guaranteed to create a new instance while Integer.valueOf() uses the integer cache. Let’s see how many integers we really have, by running the same Group By Value report with java.lang.Integer as the type:

Quite a few, though obviously not as memory-hungry as the Strings were; in fact, we have 11k’s worth of Integer instances on heap. This shows that small numbers, like 0, 1, 2, and 8 are seen a lot, as are MAX_VALUE and MIN_VALUE. Were we to fix it we’d likely get around 10k back on heap – not a huge amount, to be sure.
The number 100 seems suspicious; we’ve got a few of them kicking around. Plus unlike our other power-of-two numbers it seems to stick out. So how do we find where that comes from?
One feature of Eclipse MAT is to be able to step into a set of objects and then show their references; either incoming (objects that point to this) or outgoing (objects that they point to). Let’s see where the references have come from, by right-clicking on 100 and then “List Objects → Incoming References”. A new tab will be opened within the editor showing the list of Integral values, which can then be expanded to see where they come from:

This shows 5 instances, and their reference graph. The last one is the one created by the built-in Integer cache but the others all seem to come from the org.eclipse.e4.ui.css.core.dom.properties.Gradient class, via the GradientBackground class. We can open up the code to see a List of Integer objects, but no allocation:
public class Gradient {
    private final List<Integer> percents = new ArrayList<>();
    public void addPercent(Integer percent) {
        percents.add(percent);
    }
Searching for references in the codebase for the addPercent() method call leads to the org.eclipse.e4.ui.css.swt.helpers.CSSSWTColorHelper class:
public class CSSSWTColorHelper {
    public static Integer getPercent(CSSPrimitiveValue value) {
        int percent = 0;
        switch (value.getPrimitiveType()) {
        case CSSPrimitiveValue.CSS_PERCENTAGE:
            percent = (int) value
            .getFloatValue(CSSPrimitiveValue.CSS_PERCENTAGE);
        }
        return new Integer(percent);
    }
}
And here we find both the cause of the duplicate integers and also the meaning. Presumably there are many references in the CSS files to 100% in the gradient, and each time we come across that we’re instantiating a new Integer instance whether we need to or not.
Ironically if the method had just been:
public class CSSSWTColorHelper {
        public static Integer getPercent(CSSPrimitiveValue value) {
                int percent = 0;
                switch (value.getPrimitiveType()) {
                case CSSPrimitiveValue.CSS_PERCENTAGE:
                        percent = (int) value
                        .getFloatValue(CSSPrimitiveValue.CSS_PERCENTAGE);
                }
                return percent;
        }
}
then autoboxing would have kicked in, which uses Integer.valueOf() under the covers, and it would have been fine. Really, using new Integer() is a code smell and should be a warning; and yes, there’s a bug for that.
And as is usual in many cases, Lars Vogel has already been and fixedbug 489234:
 - return new Integer(percent);
 + return Integer.valueOf(percent);
Conclusion
Being able to fix replacements for integers isn’t specifically important in itself, but realising that new Integer() (and doubly so, new Boolean()) is an anti-pattern is the educational point here. Generally speaking, if you have new Integer(x).intValue() then replace it with Integer.parseInt(x) and otherwise replace it with Integer.valueOf(x) instead.
In fact, if you’re returning from a method that is declared to be of type Integer or assigning to a field of type Integer then you can just use the literal value, and it will be created to the right type with autoboxing (which uses Integer.valueOf() under the hood). However if you’re inserting values into a collection type then instantiating the right object is a better idea.
If you know your value is outside of the cached range then using new Integer() will have exactly the same effect as calling Integer.valueOf(). Under JIT optimisation for hot methods you’d expect them to have the same effect. However note that Integer.valueOf() could change over time (for example, to cache MAX_VALUE) which you won’t be able to take advantage of if you use the constructor. Plus, there’s also a run-time switch -Djava.lang.Integer.IntegerCache.high=1024 if you wanted to extend the cached values to more integers. This is only currently respected for Integer types though; other primitive wrappers don’t have the same configuration property.
In addition, being able to look for duplicate objects in memory and discover where the memory heap lays is an important tool in understanding where Eclipse’s memory is used and what can be done to try and resolve some of those issues. For example, digging into a stray object reference resulted in discovering that P2 has its own Integer cache despite having a minimum dependency of Java 1.5 which added the Integer.valueOf(). Hopefully we can remediate this.
Oh, and that JEDgpPXhjM4QTCmiytQcTsw3bLOeXXziZSSx0CGKRPA= string? It turns out that it’s a value in META-INF/MANIFEST.MF for the SHA-256-Digest of a bunch of (presumably empty) resource files in the com.ibm.icu bundle:
Name: com/ibm/icu/impl/data/icudt54b/cy_GB.res
SHA-256-Digest: JEDgpPXhjM4QTCmiytQcTsw3bLOeXXziZSSx0CGKRPA=

Name: com/ibm/icu/impl/data/icudt54b/ksb_TZ.res
SHA-256-Digest: JEDgpPXhjM4QTCmiytQcTsw3bLOeXXziZSSx0CGKRPA=
In fact, you might not be surprised to know that there are 300 of them :)
$ grep SHA-256-Digest MANIFEST.MF | sort | uniq -c | sort -nr
 300 SHA-256-Digest: JEDgpPXhjM4QTCmiytQcTsw3bLOeXXziZSSx0CGKRPA=
  65 SHA-256-Digest: Ku5LOaQNbYRE7OFCreIc9LWXXQBUHrrl1IhxJy4QRkA=
  61 SHA-256-Digest: TFNUA5jTkKhhjE/8DQXKUtrvohd99m5Q3LrEIz5Bj4I=
  53 SHA-256-Digest: p7PURP2WmyEtwG26wCbOYyN+8v3SjhinC5uUomd5uJA=
  53 SHA-256-Digest: fTZLTXXbc5Z45DJFKvOwo6f5yATqT8GsD709psc90lo=
  49 SHA-256-Digest: SiArmu+IqlRtLpSQb6d2F5/rIu6CU3lnBgyY5j2r7s0=
  49 SHA-256-Digest: A5xl6s5MaIPeiyNblw/SCEWgA0wRdjzo7e7tXf3Sscs=
It turns out that while investigating one optimisation you find another potential for optimisation. The manifest parser stores the manifest for the bundles, which has both the main section (where the interesting parts of the manifest live) as well as all of the other sections (including their signatures). I’m not sure that it’s really needed; it was introduced in 865896 and the only place it’s used is to attempt to capture a per-directory Specification-Title.
Since this isn’t largely used by OSGi, if modifying the runtime to not store the hash data, we can save ½Mb or so of redundant strings, though the other savings can bring into a couple of megabytes or so:

Whether this is an optimisation that can be applied, the discussion is at bug 490008.


 Here at Tasktop we really like industry standards. It's important for us to use well known tools and frameworks to make transitions between teams easier. When it comes to creating a REST API there is no way around JAX-RS in the Java world. But JAX-RS (or one of it's implementations) is not a full server stack. You always need to use some other technologies e.g. to access a database, do logging and much more.


 then add
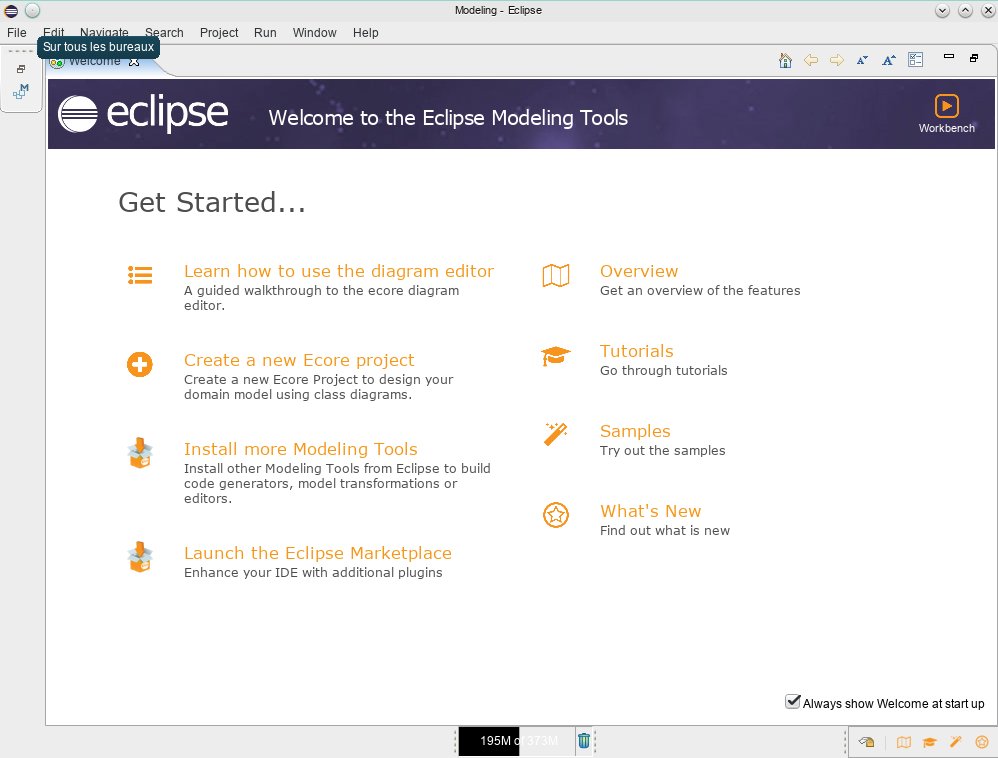
 .
.
 This improvement